Quantcast
Channel: Division of Chemical Education
Viewing all 1106 articles
Browse latest View live

Largest Periodic Table - World Record Attempt

$
0
0
IYPT Event

While meeting in December of 2017, the proclaimed 2019 the of Chemical Elements (IYPT 2019).

This year coincides with the 150th anniversary of the discovery of the Periodic System as developed by Dmitry Mendeleev. T (IUPAC) is celebrating IYPT 2019 as it marks its own 100th anniversary. This will be a year of celebrating and promoting the importance of the Periodic Table, its applications and connection with all areas of science. Many projects, contests, activities and events are being shared on social media and elsewhere. This is a great opportunity for outreach to promote understanding of the importance of the periodic table and chemistry in general.


Figure 1: World’s Largest Periodic Table Event Flyer

The , has been involved in promoting National Chemistry Week (NCW) for many years. Most recently, they have hosted Chemistry at the Mall and the local ACS Illustrated Poem Contest. This year, they are planning a special IYPT celebration to be held at (GVSU) in Allendale, Michigan (see figure 1). This event will be FREE and open to the public. The highlight of the celebration will be the unveiling of the largest periodic table. Schools, groups and local companies are each making HUGE elements (216 inches across by 162 inches tall), and when put together they will make a table that is 120 yards long by 53.3 yards tall, almost as big as a football field (see figure 2). The organizers have reached out to the in hopes of establishing this table as the largest in the world. Currently Guinness does not have an entry for world largest periodic table, but they do have an entry for the smallest.

Figure 2: The first few completed element submissions.

In addition to the Largest Periodic Table project, there will be a demo show, 16 tables with hands on activities, a college poster display and a K-12 illustrated poster contest. The celebration is planned for 10am to 2pm at the GVSU Kelly Family Sports Center (see figure 3).


Figure 3: The event will take place at the GVSU Kelly Family Sports Center.

Michelle DeWitt has been an ACS member for 26 years and has been actively involved in the local section governance and outreach for most of that time. She is the lead chemistry laboratory supervisor for GVSU. DeWitt is spearheading this project and is the lead contact for schools and other groups interested in participating by putting together an element to be included in the table. Because of the time required to put together each element, the event committee needs to have an accurate account of how many elements are complete with enough time to make a plan for completing any remaining elements, so the elements need to be delivered to GVSU by April 1st.  


Figure 4: The status of elements for the West Michigan ACS IYPT event as of 1/25/19.

 (see figure 4). If your group would like to make an element, reach out to Michelle DeWitt:  (See figure 5). Read the Participation Details pdf for important details. 


Figure 5: Michelle DeWitt 


If you are not local to West Michigan, you can find your own local events and information about the Illustrated Poem Contest at ACS.org.


National Periodic Table Day is Feb. 7th!

$
0
0
National Periodic Table Day overlay on a periodic table image

If you didn't know, is this Thursday, Feb. the 7th. More info about the day can be found on . Organizers recommend you use #PeriodicTableDay on social media to post how you are celebrating. The Periodic Table is 150 years old this year so besides observing Thursday, we are celebrating the for all of 2019! Keep reading for some of my favorite periodic table resources.

 Figure 1: The February 2019 cover of ChemMatters.

  • In David Warmflash's article, , published in this months issue of ChemMatters (see Figure 1), he explains that the table is holding up well under the test of time - and science. 
  • As a high school teacher, I love using the TED talk (see below), The Genius of Mendeleev's Periodic Table, featuring Lou Serico to introduce my students to the beauty of the periodic table. 

  • I love using stories from many of author .
  • I also show my students a video (see below) featuring Theo Gray regarding the periodic table.  (On a side note, will be a guest speaker at

  • Because 2019 has been designated the International Year of the Periodic Table, not a day goes by that I don't see a social media post regarding celebrating this milestone. For example, I just came across an article, , in Science Magazine that shows a brief visual history of the periodic table. 
  • If you wish to test your knowledge or your students knowledge of the periodic table then check out , an activity published by BBC News. 
  • Of course, you might want to try that test after watching The Periodic Table Song video below. 

No matter how you wish to celebrate the Periodic Table, you might want to get a cake or tie a balloon to your classroom periodic table. I hope you share your celebrations in the comments below and/or on social media!

Collection: 

Common Questions About the AP Chemistry Exam

$
0
0
Text reads AP Chemistry Q&A Have Questions? She Has Answers!

Each year around this time, the same questions start emerging on listservs and discussion boards about the structure and content of the AP Chemistry Exam. Teachers start to worry if they have covered all of the content and if their students are prepared enough for the daunting exam.

The is a valuable tool to answer all questions, but it is dense and sometimes hard to navigate. The best advice I have for new AP teachers at this time of the year is to take all of the as if you were a student. Familiarize yourself with how the exam is organized, how it looks when it is printed, how many questions there are, what topics come up the most, etc. It sounds like a lot, but when I first started teaching AP Chemistry I took every exam available. There are now practice exams available if you log into the . These practice exams are gold because they are formatted to match the actual exam. The practice exams contain answer sheets, guides for grading the exam, as well as scaling for the exam, and each question cites the learning objective that is elicited in the question. The practice exams should be secure, in that students should only use them in class. (Secure practice exams were created so teachers can use them to assess their students. The questions and answers should never be readily available online for students to see.) Even with all of the available resources, there are still many unanswered or unclear questions about the AP Chemistry Exam. I have compiled a few and will do my best to answer each question.


QUESTIONS ABOUT THE EXAM FORMAT AND GRADING

How is the exam formatted?

It is a great idea to familiarize your students with the format of the exam in order to allow for proper expectations and to plan their time most effectively. Most of this information can be found on the second page of this .

  • The AP Chemistry Exam Section I consists of 60 multiple choice questions, 10 of which are field testing questions (these questions will not be counted towards their final grade, but the students will have no way of knowing which questions the field testing questions are).
  • The questions are bound in a book with a reference table in which they have to turn back and forth between the questions and the tables.
  • Students may write notes and scratch work anywhere on the exam, but are required to answer the questions on the provided answer sheet within 90 minutes. Exam readers that attend the reading in June never see these multiple-choice questions.
  • Students cannot use any calculators during the multiple choice section of the exam.
  • Students should be given a short break between the multiple-choice section and the free response section. The students receive all new exam packets for section II. The students are given a new bound book containing a fresh reference table.
  • The free response section consists of three long questions, each requiring an average of 23 minutes and awarding the students up to ten points each.
  • There are also four short questions requiring an average of nine minutes and awarding up to four points each.
  • Each free response question is written on one to two pages with no space for work. After the question, multiple pages of paper are provided in the bound book for the responses.
  • Students are encouraged to use a calculator during the free response section of the exam.
  • Section I multiple choice questions account for 50% of the exam score; section II free response accounts for the other 50% of the total score.


Why are the secure practice exams only 50 multiple choice questions, while the actual AP Chemistry Exam has 60 multiple choice questions?

As stated above, ten of the 60 multiple choice questions on the AP Chemistry Exam are field test questions and will not count toward the students’ grade. There is no way to know which questions they are while taking the exam, so the students need to answer every question. The College Board has chosen to omit those field questions and only release the 50 gradable questions. Now an additional question arises; what do I do about the timing and grading for my "in class" practice exam? Well, you have a few options:

  1. Leave the practice exam as is and only allow 75 minutes to answer the 50 questions. Each multiple choice question should take approximately 1.5 minutes on average to answer regardless of the sum of the questions. Then, use the grading rubric found at the end of the practice exam to score the exam.
  2. Add ten more questions of your own and keep the 90-minute time limit. Then you must decide: would you like to grade those extra ten questions and change the grading scale? Or should you not grade those questions and keep the grading scale intact?


Can students write in pen or pencil on the AP Exam?

Either pen or pencil are ok. Pencils are great to fix mistakes, however, tell students to write legibly and dark. Light pencil is difficult to read.


If a student makes a mathematical error in the first part of a question, are they punished on the next part (double jeopardy)?

There is no double jeopardy. If a student makes an error in part a and needs to use it in part b, the AP reader will follow along with the math to ensure they have the new correct answer. It is more important that the student shows an understanding of how to solve part b than for the student to have carried down the correct numbers.


QUESTIONS ABOUT THE EXAM CONTENT

In this section, I will try to answer questions that have come up time and time again about the content of the exam. Where applicable, I have cited an exam question that deals with the topic. You can find these exams on the when you scroll down the page.


How are significant figures scored on the AP Exam?

One answer will be scored on the entire short answer section per exam. This is one point out of the 100 total points of the exam. The exam question associated with significant figures will most likely not be labeled and the students will have no way of knowing when to use significant figures; therefore, they must round their answers to the appropriate number of significant figures for every calculation to obtain the single point. Since significant figures carry so little weight on the AP Exam, teachers may not need to emphasize them as much as we probably do in class. Here’s a significant figures tip though: try to make sure students don’t round molar masses to values less than the number of significant figures given in the example. Don’t round the molar masses from the periodic table that is provided with the AP Exam. Another way significant figures can be addressed is when reading measurements. Be sure to teach students to read “a place beyond” what they see on the device. For example, the 2018 Exam question 1d asked students to report a temperature change from the graph and students needed to report 12.5 degrees Celsius, whereas 12 and 13 were not accepted. (Also reference 2016 Exam question 7a.)


Do the solubility rules need to be memorized?

Since the redesign in 2014, students should know that group 1 ions, acetate, nitrate, and ammonium ions are soluble. All other rules will be considered insoluble unless noted in the stem of a question.


Does the activity series need to be memorized?

No. But, knowing that there is one can be relevant. Students should be able to explain reactivity with a group of metals or nonmetals. Some teachers still hand out the standard reduction tables from the old AP Exam reference tables and use them to tie in to electrochemistry in order to predict which species is more likely to be reduced or oxidized (2017 Exam question 7a and 2016 Exam question 3e).


Net ionic equations used to take up all of question 4 on the exam. Are they no longer assessed?

They are absolutely assessed. Instead of having an entire question devoted to reaction writing, net ionic equations have been factored into the other questions. On the 2018 exam, question 1g asked for the balanced net ionic equation for a given reaction. In 2017, question 3ci, students could have used a net ionic equation to help them explain their answer. In 2016, question 3f, students created a net ionic equation from half reactions. In addition, many net ionic equations will appear in the multiple choice section of the exam.


Will students need to memorize electronegativity values in order to determine types of bonds?

No. Instead have students learn the general trends for periods and groups. Start the unit by practicing these trends using a table of electronegativity values and then we move on to just using the trends to determine polarity. I do have my students memorize that carbon and hydrogen are close enough to be considered nonpolar.


While teaching intermolecular forces of attraction, how will students know when London dispersion forces are stronger than hydrogen bonding?

A data table will be given with boiling points or other evidence of compounds that need to be compared. Generally, London dispersion forces are the weakest force present in all compounds, but dependent on the number of polarizable electrons, these forces can multiply quickly (2018 Exam question 4a and 2017 Exam question 1dii). A common mistake some students make is they try to reason against the exam data and argue the data is incorrect. It is important to explain to students that unless the question is asked, “Do you agree or disagree…” then the data given is unarguable.


Students really need to memorize all of the VSEPR shapes, bond angles, and hybridizations!?

Yes. There is no way around it. All geometries, including those of expanded octets should be known, as well as their general bond angles. Understanding that increasing the number lone pairs on a central atom will decrease the bond angle is helpful, but the actual values aren’t assessed (2017 Exam question 1cii). Hybridization is limited to compounds that obey the octet rule, and therefore limited to sp, sp2, and sp3 (2015 Exam question 1e).


Do students always need to draw the structure that reduces the formal charge?

No. Structures that obey the octet (and may not have a reduced formal charge) are acceptable. Formal charges can be used to rationalize which structure may be a better representation of the bonding in a specific molecule (2017 Exam question 2a).


Will students need to calculate the lattice energy of an ionic compound?

No. They should know how to qualitatively compare lattice energy values of various compounds using Coulomb’s Law by comparing atomic radii and the distance between the ions (2018 Exam question 3c and 2017 Exam question 6b).


Do students need to me memorize all of the polyatomic ions?

Students can perform decently well on the AP chemistry Exam without fully memorizing the polyatomic ions. However, knowing the polyatomic ions will help with strong acids and bases, formula writing, electrochemistry, etc. I have my students memorize the important”-ates” (such as sulfate, acetate, nitrate, phosphate, carbonate) and then understand the rules for “-ites,” “hypo—ites,” and “per—ates.” A lot of teachers also use a mnemonic device known as “Nick the Camel”. I looked it up on Google and started using it this year. My students loved it.


Does the order of electron configuration matter? And should they know the exceptions for d4 and d9 groups?

Students are allowed to write 3d before or after 4s as long as they have an understanding that the 4s sublevel is the valence sublevel in which electrons will be removed and added to first. Exceptions to the Aufbau are no longer assessed.


Are phase diagrams (triple point diagrams) assessed? Crystal structures? Lewis acids and bases? Colligative properties?

No. I still use phase diagrams to practice graphical analysis and discuss relationships between temperature and pressure. Crystal structures are no longer assessed. Lewis acids and bases are not assessed. Colligative properties are not calculated, as they are considered part of a first year chemistry course (AP chemistry is a second year course according to College Board).


Do students need to graph integrated rate laws?

No. Students do not need to have a graphing calculator at all. When the integrated rate laws are referenced in questions it is usually easily answered with the concept that zero order reactions are graphed [A] versus time, first order reactions are graphed ln[A] versus time, and second order reactions are graphed 1/[A] versus time. Whichever graph is the straighter line is the correct order of the species (2016 Exam question 5b). In the 2107 exam question 2eii, the students were given an exponential decay graph of a species and asked to explain how the graph represents a first order proposed rate law. Some students tried to graph the data by running the natural log of the given concentrations versus time, but the students only obtained credit if they proved they actually graphed the data by showing the calculations and retention values. Most students did not provide the proof needed to answer the question and merely stated, “If I had graphed the natural log of the concentration versus time I would have obtained a straight line that would indicate first order” which was not enough. The acceptable answer was that the graph represents a decomposition reaction with a constant half-life, which proves it is first order. As you can see, these questions do not need the graph to be created and can be answered by other means. Having stated this, I still have my students perform labs with graphing calculators for the experience of knowing what to set at x and y axes.


Do students need to use the quadratic formula for acid base equilibrium questions?

No. Many calculations can be solved one of three ways. Either an equilibrium concentration is given in the stem of the question which can be used to determine the “x” value (2017 Exam question 3b or 2014 Exam question 2b), the equilibrium expression has squares on both the numerator and denominator in which one can take the square root (for example x2/(5-x)2 found in question in multiple choice sections), or the value of the equilibrium constant is so small the student can say the change in concentration of the given species is negligible; therefore, eliminating the change in the equilibrium expression, taking the square root of both sides and solving without a quadratic equation (2016 question 4a). In the last scenario, which is very common, students do not need to prove the change is small enough to be ignored, however, if asked what the final concentration is of the initial species, or if asked to plug it into another formula such as percent ionization of the acid, students do need to subtract the x value (change value) from the initial concentration value, in case it does show a slight decline in concentration at equilibrium (2018 question 5b).


Will students need to balance redox reactions in acidic and basic solutions?

Not entirely. Students may be given two half reactions that they may need to cancel species and sum for an overall reaction that have already been balanced in acidic or basic conditions. Or, students may need to pick out one half reaction from an overall reaction (2018 Exam question 3d). I still have my students learn the method of balancing so they know where those half equations that were given originated and are not seeing it for the first time on the exam. Generally, students still need to be able to assign oxidation numbers, determine which species is oxidized and which is reduced, and sum reactions. The reducing agent and oxidizing agent terms and concepts has been removed from the AP Exam. Therefore, practicing this method of balancing in acidic or basic solutions helps practice other learning objectives but is not directly assessed.


What do students need to know about organic compounds?

There are no direct organic chemistry questions on the AP Chemistry Exam. Students will not be asked to name organic compounds, identify isomers, or organic reactions. Some questions may use organic compounds in questions about Lewis Structures and bond angles, or for intermolecular forces of attraction comparisons. Therefore, it is a good idea to use organic compounds in class during these topics. But there is no need to focus on nomenclature or specifics about organic chemistry. All questions involving organic compounds can be answered using bonding, intermolecular forces, or other topics in the curriculum.


Is the [Kc/Kp conversions, Arrhenius equation, Nernst equation, Freezing point depression calculation, Molecular Orbital Theory, root mean square velocity, etc.] on the exam?

Generally, if it isn’t on the AP Chemistry reference table, it is not something the students will need to calculate. Make sure you have the most up to date equations list, as items have been removed since the exam redesign. It is your decision if you would like to teach past the scope of the course, knowing that some of these equations might help describe and prove chemical phenomenon better. Some items I did have my students memorize as far as calculations are concerned are:

  • Enthalpy Change = [Sum of the Bonds Broken] – [Sum of the Bonds Formed] (2017 question 2b)
  • M1V1=M2V2 for dilutions (although two molarity calculations can be used)


I have two weeks left and three topics to teach, what can I leave out?

This is quite a tricky question. Everything in chemistry in interconnected. It is hard to fully understand the scope of chemistry without every piece of the puzzle. It is equally difficult to pack in this much information into one year. I coded the last six practice exams (multiple choice and short answer) by subtopic to use as reference when I write my own exams. I found that the most assessed topics include: stoichiometry, bonds and intermolecular forces, kinetics, equilibrium, acids and bases, and thermodynamics. The less assessed topics appear to be atomic structure, periodicity, and electrochemistry. Again, all topics should be covered and will be assessed on each exam. But skipping a topic such as acid base chemistry would be a major mistake.


More on the Periodic Table

$
0
0
Periodic table display

"What are we doing to help kids achieve?"

I have an extreme fascination with the periodic table. I have four periodic table neck ties, a periodic table bow tie, multiple periodic table t-shirts and, my pride and joy, my . I like to call those my "Air Chads". We have two new display areas in our science wing. Mike Geyer, one of my friends and a great chemistry teacher, took charge of these. He loves the periodic table as much as I do. To celebrate the 150 year anniversary of the periodic table he is displaying new tid bits of information each week. First, he worked with the tech department to display a powerpoint about the periodic table that runs 24/7. Along with this is a live twitter feed all about the periodic table. Bottom line....it is the history of chemistry. Here is a real shocker. Kids are taking notice. I have actually seen students in the hallway staring at a screen that is not their phone streaming Netflix! It is kind of shocking. It is also a really pleasant change in the culture.

Maybe you do not have the time that Mike does. However, wouldn't it be cool to have groups of students do something like this for a project or extra credit? We started talking as a department about what we can do when Mike runs out of ideas (if that ever happens). Doug Ragan just wrote about periodic tables as well. Check out his post, , for more ideas.


As a tie in with the periodic table, my daughter had to have a medical test with a couple of radioactive isotopes, gallium and technecium. These isotopes were placed in eggs and juice that she was given. She digested these and then they took a "picture" of the isotopes as they travelled through her to see how her stomach was working. The good news is she got a clean bill of health. I asked the technicians at Children's Hospital in Cincinnati if I could record this. I explained that students have many misconceptions about radioactivity. One misconception is that if they get close to anything radioactive that it could be dangerous. Hospitals depend on radioactive isotopes to do safe tests similar to the one my daughter had. The technicians were thrilled that I was using this for educational purposes. Check out the video below.

If you have any cool idea about celebrating the periodic table, please share!


Are Great Teachers Born or Made?

$
0
0
classroom with students

Greatness is easily recognized. Whether it be in sports, music, or writing, there is often a short list of contenders for the greatest of all time. How greatness is achieved, on the other hand, can be difficult to explain.

In Malcolm Gladwell’s 2008 book, Outliers, Gladwell considers the factors that lead to high levels of achievement in a broad range of vocations. Although he acknowledges the fact that heredity and environment contribute to success, practice emerges as a common theme among the greats. Gladwell attributes high levels of success, in part, to the 10,000-Hour Rule, which states that the key to achieving greatness is deliberate practice for at least 10,000 hours.1 For example, consider Tom Brady, New England Patriots quarterback. With numerous NFL records and 6 Super Bowl championships, he’s arguably one of the greatest NFL quarterbacks of all time. In a 2017 interview, Brady explained that he prepares for 16 hours per day during the week before a game.2 Practice is key to his success.


Figure 1: Malcolm Gladwell’s 2008 book

Practice is clearly essential for achieving excellence in sports, but is it also required for success as a teacher? Before answering this question, it is necessary to recognize that greatness in teaching is more difficult to define than greatness in endeavors like sports or business. Championship wins and net worth provide simple measures of success in sports and business, however, these evaluations cannot be applied to teaching ability. One way of defining greatness in teaching is to simply describe it. For instance, stakeholders have developed lists of the desired characteristics of an instructor. Although these types of lists vary, there is significant overlap among them.3,4,5,6,7 For example, great teachers tend to be described as:

  1. Enthusiastic
  2. Knowledgeable
  3. Skilled in a variety of instructional methods
  4. Able to communicate clearly and effectively
  5. Organized
  6. Respectful
  7. Empathetic

Some of these qualities are skills that can be learned, while others are more likely naturally occurring, and researchers have attempted to categorize them in this way. For example, Childs (2009) summarized the characteristics of good teachers into three categories: (1) attitude towards students, (2) personal qualities, and (3) teaching skills and practices.5 Alternatively, Arnon and Reichel (2007) used two categories: (1) personality and (2) professional knowledge.8 Some of these represent qualities that are learned (teaching skills and professional knowledge), while others are natural (personality and attitude).


So, are great teachers born or made?

The consensus is that people are not born with skills and professional knowledge that are necessary for teaching. Some people may have a more naturally agreeable personality, however, teaching skills and knowledge are learned over time.9 Similar to Gladwell’s outliers, it takes hard work and experience for this type of knowledge to develop. In the same way that a person who has never touched a piano would not be able to sit down and play a piece from Beethoven, a person who has never taught a subject will not be as effective as someone who has taught that subject for years. To become an expert pianist, it takes years of dedicated practice, and it is the same way with teaching.

Figure 2: Knowledge for teaching [Modified from Grossman (1990)]4

Many researchers have attempted to characterize the knowledge of an expert teacher, and it's complex, to say the least. A teacher has many forms of knowledge, but one arguably stands as chief among them. It’s called Pedagogical Content Knowledge (PCK), and it’s the missing link that transforms a person from someone with a lot of subject matter knowledge into a master educator.10,11 PCK is a vital component in becoming a great teacher and in my next post, we will consider how we can work to develop this unique form of knowledge.


References

  1. Gladwell, M. (2008). . Hachette UK.
  2. McKenna, H. (2017). Behind Tom Brady’s preparation for Super Bowl LI. Retrieved from
  3. Feldman, K. A. (1989). Instructional effectiveness of college teachers as judged by teachers themselves, current and former students, colleagues, administrators, and external (neutral) observers. Research in Higher Education, 30(2), 137-194.
  4. Grossman, P. L. (1990). The making of a teacher: Teacher knowledge and teacher education. Teachers College Press, Teachers College, Columbia University.
  5. Herrington, D. G., & Nakhleh, M. B. (2003). What defines effective chemistry laboratory instruction? Teaching assistant and student perspectives. Journal of Chemical Education, 80(10), 1197.
  6. Childs, P. E. (2009). Improving chemical education: turning research into effective practice. Chemistry Education Research and Practice, 10(3), 189-203.
  7. Hassard, J., & Dias, M. (2013). The art of teaching science: Inquiry and innovation in middle school and high school. Routledge.
  8. Harris, A. (1998). Effective teaching: A review of the literature. School Leadership & Management, 18(2), 169-183.
  9. Arnon, S., & Reichel, N. (2007). Who is the ideal teacher? Am I? Similarity and difference in perception of students of education regarding the qualities of a good teacher and of their own qualities as teachers. Teachers and Teaching: theory and practice, 13(5), 441-464.
  10. Lederman, Norman G., and Sandra K. Abell, eds. Handbook of research on science education. Vol. 2. Routledge, 2014.
  11. Shulman, L. S. (1986). Those who understand: Knowledge growth in teaching. Educational Researcher, 15(2), 4-14.
  12. Shulman, L. (1987). Knowledge and teaching: Foundations of the new reform. Harvard educational review, 57(1), 1-23.

Preview image: Classroom with teacher and students found on .

Collection: 

Mole Unit Mini-Practicums

$
0
0
measuring utensils and flour

As I planned for my mole unit this year, I thought about how fundamental the mole concept is for stoichiometry and brainstormed ways to really make it stick. I usually do a lab practicum at the end of every unit. I have shared about my before. For the mole unit, I decided to do multiple mini-practicums, one for each learning target of the unit. Here are my learning targets and a brief description of the mini-practicums I did.

Target 1: I can convert between mass and moles of an element or compound.

For this learning target, I gave students the “mole mug brownie” recipe and conversion chart (figure 1) and asked them to convert the measurements to the dreaded imperial units we use to bake with.

Figure 1: Recipe and Data for Converting Units

After students did all of their math, they did get to test out their calculations by actually making the mole mug brownie. Reviews on the actual brownie were mixed but the math concepts definitely stuck!


Target 2: I can convert between the number of particles and moles of an element or compound. 

For this learning target, I gave each group a stick of chalk and the challenge in figure 2.

Figure 2: Directions for Chalk Challenge

While this practicum did not have an edible element, students really enjoyed writing on their lab stations (see figure 3) with chalk!

Figure 3: Chalk Signature on Lab Counter


Target 3: I can relate the molar concentration (molarity) of a solution to the number of moles and volume of the solution. 

For this learning target, I tried something I had never done before. I gave each group a small (50 - 100mL) volumetric flask and a given molarity (different molarity for each group). It was up to each group to mix a solution of copper (II) chloride to their given molarity. I tested each group’s solution using my Vernier SpectroVis and a Beer’s Law curve I had created the day before. Students thought the spectrometer was pretty cool and enjoyed the instant confirmation that they mixed their solution correctly.


Target 4: I can determine the empirical formula of a compound given the mass or percent composition.

For this learning target, I used my typical end of the unit practicum, find the formula of a hydrate. I have used different hydrates in the past but this year I used copper (II) sulfate pentahydrate. If you have not done this lab before, it is super simple and yields reliable data. Students heat their hydrate in a crucible to drive off all of the water. They use the before and after masses to calculate their moles of water in their sample and ratio it to their moles of copper (II) sulfate. The only thing I provide my students before they begin is a brief introduction to hydrates and an overview of how to heat a sample using a crucible.

I also have a learning target for molecular formulas (I can determine the molecular formula of a compound given the mass or percent composition and molar mass) but I did not make a separate practicum for it. Instead, I gave students the accepted molar mass for the copper (II) sulfate pentahydrate they were testing to compare their lab data to.

Since the mole unit involves a lot of practice, these practicums were a nice way to break up the worksheet/whiteboarding cycle, keep students engaged and reinforce concepts!

Safety: 

Molecule Monday

$
0
0
Molecule Monday next to a cup of coffee on teal background

In August 2016, I attended the New England Association of Chemistry Teacher’s summer conference in North Adams, MA at the Massachusetts College for Liberal Arts (MCLA). As with many conferences for chemistry teachers, there were a mix of lectures about recent research in chemistry, lab experiences to bring to the classroom, and pedagogy from other chemistry teachers. I left the conference feeling energized, but a bit overwhelmed. How could I best incorporate any of the ideas I learned into the classroom?

One of the talks was by Dr. Robert Harris, a chemistry professor at MCLA titled “The Best Biomolecule of the Week” where Dr. Harrisspokeof how he engaged his sometimes reluctant organic chemistry students. That idea stuck with me as something I could do in my classroom and engage my students with chemistry. I teach at an agricultural high school where my students spend half their dayin the four core academic courses, and then spend the rest of the day in their vocational classes including grooming dogs, climbing trees, designing flower arrangements, and riding horses. My students apply and choose to come to my school as a vocational major, but are often less excited about their academic courses. I thought if I could bring in a molecule related to the different vocationals, they would see this course connected to their chosen fields and as a result see chemistry as something in their daily lives. I wanted Molecule Monday to be a time set aside for class discussion, not necessarily something they would be tested on.

Shortly afterI left the conference, I began planning how to incorporate this idea into my weekly routine. I decided I would set aside Sunday evenings to considerthe class material and calendar to choose the appropriate molecule for the week.

For the first Monday of the school year, I chose caffeine. I began class with the skeletal structure of this organic molecule (see figure 1). I asked my students to make observations.

Figure 1: Skeletal structure for caffeine

  • What did the structure look like to them?  

  • Whatelements did they see?

  • Was the structure large or small? Why?

  • Did they think the structure was complicated or simple? Why did they think so?

The next slide had properties of the compound where I introduced the students to what a chemical formula means. For example, I displayed caffeine’s formula, C8H10N4O2, and read it aloud. Then I translated the formula and explained this meant eight carbons, ten hydrogens, four nitrogens, and two oxygens. I returned to the image often and pointed out the individual elements and showed them each corner represented a carbon connected to a number of hydrogens. Then, I displayed the IUPAC name and returned to the image to show them how the IUPAC name relates to the structure.

From here, we looked at physical and chemical properties of the molecule. This can take on different meanings depending on where we are in the curriculum. The density of a molecule is important after the first unit, while molar mass becomes important later on in the year.

Afterwards, we move on to information about how and where we have seen the compounds being used, all before identifying the actual compound. We briefly discuss the history of the molecule, its uses, and dangers. Students enjoy guessing the identity of the molecule until the last slide where I showed them images of examples of where the molecule is used. In the case of caffeine, I used an image of coffee.

The weeks when we have not met on a Monday or an alternative time for a Molecule Monday, the students have been disappointed and looked forward to the next Monday. I recently asked my students why they look forward to Molecule Monday.

  • They love seeing the random facts about everyday fun things.

  • They enjoy hearing about molecules that you wouldn’t ordinarily hear about in class.

  • It is fun to try and figure out what molecule it is.

  • It is cool to see how it’s all put together.

  • It is interesting to break down common items into their molecules.

With such precious little class time, why have I devoted 10-15 minutes almost every Monday to this? We all look for ways to engage with our students and help them make the content relevant. This is just one approach. In the future, I hope to have my students create their own Molecule Monday and find ways to make the content meaningful to them.

Curious about Molecule Monday or want to add your own? You can find some of my Monday Molecules presentations below.

Preview Photo by  on .

Collection: 

JCE 96.02 February 2019 Issue Highlights

$
0
0
Journal of Chemical Education February 2019 Cover

Collaboration among Chemical Educators

The February 2019 issue of the Journal of Chemical Education is now available to subscribers. Topics featured in this issue include: microplastics and environmental chemistry; examining outreach practices; investigating acid–base chemistry; using Arduino to experiment with carbon dioxide; innovative approaches to analytical chemistry; three-dimensional visualization and tactile learning; understanding Lewis structures; synthesis laboratories; exploring physical chemistry; from the archives: celebrating the International Year of the Periodic Table.

Cover: Microplastics and Environmental Chemistry

Microplastics and microfibers are small particles of plastic that have either degraded from larger plastic items or originated from primary microplastic pollution sources (such as microbeads in cosmetics). Microplastic pollution is an area of emerging concern because of the ubiquity of particles in multiple environments and their persistence in the food chain. In the laboratory experiment , Laura Rowe, Maria Kubalewski, Robert Clark, Emily Statza, Thomas Goyne, Katie Leach, and Julie Peller discuss how first-year undergraduate chemistry students quantified the amount of microplastics and microfibers in their local soil during a 2- or 3-week mini-research project. As shown on the cover, the students combined density gradient separation and the Fenton reagent with filtration and microscopic identification to visualize the microplastic pollution they unearthed.

Other environmental articles in the issue include:

~ Isabel Rubner, Ashton J. Berry, Theodor Grofe, and Marco Oetken

~ Jessica C. D’eon, Jennifer A. Faust, C. Scott Browning, and Kristine B. Quinlan

~ Fun Man Fung, Wen Yi Choo, Alvita Ardisara, Christoph Dominik Zimmermann, Simon Watts, Thierry Koscielniak, Etienne Blanc, Xavier Coumoul, and Rainer Dumke

Commentaries

Stacey Lowery Bretz (Miami University and member of the JCE Editorial Advisory Board) discusses in her editorial whether there is

Michael T. Ashby and Michelle A. Maher examine .

Examining Outreach Practices: Student Beliefs about Teaching and Learning 

~ Justin M. Pratt and Ellen J. Yezierski

Investigating Acid–Base Chemistry

~ Olivia M. Crandell, Hovig Kouyoumdjian, Sonia M. Underwood, and Melanie M. Cooper

~ Donald K. Schorr and Dean J. Campbell

~ Jacqueline L. Linder, Sumeja Aljic, Hamzah M. Shroof, Zachary B. Di Giusto, James M. Franklin, Shane Keaney, Christopher P. Le, Olivia K. George, Andrew M. Castaneda, Lloyd S. Fisher, Virginia A. Young, and Adam M. Kiefer

~ Marcie B. Wiggins, Emma Heath, and Jocelyn Alcántara-García

~ Samuel C. Costa and Julio C. B. Fernandes

Using Arduino to Experiment with Carbon Dioxide

~ Seong-Joo Kang, Hye-Won Yeo, and Jihyun Yoon

~ Hernan Pino, Vanesa Pastor, Carme Grimalt-Álvaro, and Víctor López

Innovative Approaches to Analytical Chemistry

~ Marta Ferreiro-González, Antonio Amores-Arrocha, Estrella Espada-Bellido, María José Aliaño-Gonzalez, Mercedes Vázquez-Espinosa, Ana V. González-de-Peredo, Pau Sancho-Galán, José Ángel Álvarez-Saura, Gerardo F. Barbero, and Cristina Cejudo-Bastante

~ Shun Yu Tan, Katja Hölttä-Otto, and Franklin Anariba

~ Alice H. Suroviec, Katarina Jones, and Grace Sarabia

Three-Dimensional Visualization and Tactile Learning

~ Robert J. LeSuer

~ Denis Fourches and Jeremiah Feducia

~ Sonali Kurup and Prashant Sakharkar

Understanding Lewis Structures

~ S. A. Finkenstaedt-Quinn, E. P. Snyder-White, M. C. Connor, A. Ruggles Gere, and G. V. Shultz

~ Patrick L. Duffy, Kory M. Enneking, Tyler W. Gampp, Khatijah Amir Hakim, Amelia F. Coleman, Krista V. Laforest, Dylan M. Paulson, Erik T. Paulson, Justin D. Shepard, Jessica M. Tiettmeyer, Kristina M. Mazzarone, and Nathaniel P. Grove

Synthesis Laboratories

~ Michael Croisant, Stacey Lowery Bretz, and Dominik Konkolewicz

~ Shahrokh Saba and Ariel Corozo-Morales

~ Robert L. Schrader, Patrick W. Fedick, Tsdale F. Mehari, and R. Graham Cooks

Exploring Physical Chemistry

~ Lionel M. Raff and William R. Cannon

~ Rodrigo Papai, Mayara Araujo Romano, Aline Rodrigues Arroyo, Bárbara Rodrigues da Silva, Bruno Tresoldi, Gabriela Cabo Winter, Julia Messias Costa, Maria Aparecida Freitas Santos, Matheus Damasceno Prata, and Ivanise Gaubeur

~ Katherine N. Gascon, Steven J. Weinstein, and Michael G. Antoniades

~ M. G. Marmorino

From the Archives: Celebrating the International Year of the Periodic Table 

With 2019 marking the 150th anniversary of the periodic table of chemical elements, this year has been proclaimed the "" by the United Nations General Assembly and UNESCO. There are many resources in the Journal for making the most of this year’s celebration. A great place to start is Erica Jacobsen’s comprehensive listing of JCE resources from October 2009 and before in:

.

This issue includes two articles on teaching periodic trends through the use of technology: 

~ Robert J. LeSuer

  ~ Matthew E. Lopper

Additional recent resources on the periodic table include:

~ Mark J. Winter

~ Timothy J. Wallington, James E. Anderson, Donald J. Siegel, Michael A. Tamor, Sherry A. Mueller, Sandra L. Winkler, and Ole J. Nielsen

~ Dennis Fantin, Marc Sutton, Lena J. Daumann, and Kael F. Fischer

~ Vasco D. B. Bonifácio

Additional recent resources for engaging students with the periodic table and periodic trends include:

~ Jodye Selco, Mary Bruno, and Sue Chan

~ Adam Hoffman and Mark Hennessy

~ Mikhail Kurushkin

~ Thomas S. Kuntzleman, Kristen N. Rohrer, Bruce W. Baldwin, Jennifer Kingsley, Charles L. Schaerer, Deborah K. Sayers, and Vivian B. West

~ Antonio Joaquín Franco-Mariscal

~ Sibrina N. Collins and LaVetta Appleby

Additional games for exploring the periodic table:

~ Vicente Martí-Centelles and Jenifer Rubio-Magnieto

~ Eylem Bayir

~ Antonio Joaquín Franco Mariscal, José María Oliva Martínez, and Serafín Bernal Márquez

~ Chang-Hung Lee, Jian Fan Zhu, Tien-Li Lin, Cheng-Wei Ni, Chia Ping Hong, Pin-Hsuan Huang, Hsiang-Ling Chuang, Shih-Yao Lin, and Mei-Lin Ho

~ Klaus Woelk

~ Sushama D. Joag

Celebrating the JCE Periodical Table of Contents: A Monthly Resource Since 1924

With JCE in its 96th volume and for each volume there are 12 issues, you’ll find lots and lots of content in the Journal of Chemical Education to examine and use—including the present , as well as in past issues of the . Articles that are edited and published online ahead of an issue () are also available.


Especially JCE: February 2019

$
0
0
February 2019 Cover of the Journal of Chemical Education

When was the last time you thought about paper? Really thought about it. Even before the shift to a digital age, with a push to go paperless, it was somewhat a throwaway, unnoticed material. But, it is one rich in chemistry. For 2019  (CCEW), the American Chemical Society’s chosen theme encourages us to “Take Note” of it and its chemistry.

The article  (available to JCE subscribers) in the February 2019 issue of the Journal of Chemical Education helps readers do just that. Color-changing goldenrod paper and its associated demonstrations like  have been around for quite some time. However, the paper, with its special dye, was not readily available to buy for a period of time. It is now back and available ( is one supplier), and authors Schorr and Campbell point out several extensions to past demonstrations related to this special paper.

In addition to the most often seen yellow to red color change, when ammonia or another base is sprayed on the paper, they highlight other changes, such as a change to purple-black when 3 M hydrochloric acid is used, or a whitish color with bleach. Figure 2 from the article highlights a possible way to showcase this goldenrod range of possibilities, using paper flowers dipped in (left to right) 3 M HCl, undipped, sodium carbonate solution, household bleach. The containers in front tie in with a more in-depth discussion by the authors of a specific dye compared to curcumin, which can be used to make a .

Figure 2 – Reprinted with permission from Demonstration Extension Based on Color-Changing Goldenrod Paper, Donald K. Schorr and Dean J. Campbell. Journal of Chemical Education, 96 (2), 308-312. Copyright 2019 American Chemical Society.

Along the way, the authors make note of other paper-based chemistry that can be done without the special goldenrod paper. This includes an additional color change, when iodine solution on many papers changes from brown-yellow to blue-black, due to the presence of starch-based compounds. Students could also explore the bubbling reaction mentioned by the authors, when copier paper was placed in hydrochloric acid. I experimented with strips of paper, taped onto pencils and suspended over clear, colorless glasses. With tap water in one and white household vinegar in another, the bubbling action was obvious with the vinegar. The bubbles even lifted the paper strip in the glass. Larger bubble pockets were visible within the strip. Calcium carbonate is a common filler used in paper, to help make the paper more opaque and brighter, while being less expensive than cellulose.

More from the February 2019 Issue

Want more color-changing chemistry? Look to Mary Saecker’s category “Investigating Acid–Base Chemistry” in her post You’ll find an experiment that links homemade fermented foods with pH changes described in .

What else have you used from the Journal in your classroom? Share! Start by submitting a , explaining you’d like to contribute to the Especially JCE column. Then, put your thoughts together in a blog post. Questions? Contact us using the ChemEd X .

Collection: 

peergrade- Student Electronically Peer Edit

$
0
0
peergrade text over keyboard

“What are we doing to help kids achieve?”

How many of you got into teaching because you love grading papers? Most teachers are not excited about this aspect of their profession. Another difficult aspect is when students turn in materials with questionable information. Double blind peer reviews are a critical aspect of the scientific process (Hatcher, 2011). A paper that is peer reviewed multiple times garners enormous amounts of feedback to the student that one teacher cannot provide. Practitioners of use this instructional practice with students. It helps to keep everyone honest when there are many sets of eyes on the same paper. Peer reviews promote integrity and appropriate constructive criticism. Students can be instructed on how to provide proper feedback through the peer review process. It sounds great, but is difficult on a practical scale in the classroom...until now.

Peergrade is a site that allows students to upload papers and then do peer reviews. I first heard about it through Argument Driven Inquiry. I then found a fellow teacher who uses this site with her English students. Three of my classes were just finishing lab reports so I decided to give it a try.

First, I created an account. Next I set up three classes. Peergrade then allowed me to create an assignment with a rubric. I could quickly custom make a rubric or search for rubrics. Students joined the class through a code provided by Peergrade. They uploaded their lab reports. Each student electronically received three lab reports without any names on them. Students “graded” the reports with the rubric I designed. Students then examined their now reviewed paper in Peergrade. Each student had three reviews with comments and suggestions. They responded to these and then start working on their final draft.

The teacher is able to watch and monitor all student activity. Students engage in blind reviews. The teacher is able to see the names on all reviews and comments. There is also the option to allow students to do this “live” in class or to have students do this over time. Finally, when the final student report is turned in, after multiple reviews, it is extremely easy for the teacher to grade. Students have had a number of chances to fix mistakes. Peergrade worked amazingly well the first time I used it. There is a low learning curve and many short instructional videos to help teachers. Students also found this to be helpful. I certainly recommend that teachers give this a try.

Hatcher, T., , Journal of Scholarly Publishing, 42(2), 2011, 142–159.


Alt. Title: 

Peergrade

Publication Date: 
Sunday, February 17, 2019

Chemical Mystery #14: Loves Me…Loves Me Not

$
0
0
Disappearing color

Here’s a fun demonstration I did for my students on Valentine’s Day:

I’m thinking it might be a bit too easy for most ChemEdX readers to determine how to do this Valentine’s Day experiment. So I’ve prepared an experiment specifically for the readers at ChemEdX that’s a bit more complicated:

If you know your chemistry, you can figure out how I did these experiments. Leave a comment if you think you know how either of these experiments are done. Happy Valentine’s Day, and happy experimenting!

Element of the Month - An Introduction

$
0
0
Element of the Month Intro

In honor of the this series of articles details the Element of the Month project developed by Stephen W. Wright (SWW), Associate Research Fellow at Pfizer Inc., and Marsha R. Folger (MRF), chemistry teacher (now retired) at Lyme – Old Lyme High School in Connecticut (see figure 1). - Editor

Figure 1: Marsha Folger & Stephen Wright

Since the elements were first organized into a periodic table, the value of a thorough knowledge of the organization of that table has been obvious to anyone working in any area of chemistry. Further, a familiarity with the chemistry of some of the elements more commonly encountered in everyday life would be a valuable learning experience for all students, regardless of whether they pursue further studies or careers in the sciences.

In the area of chemical education, the focus on the periodic table has evolved from one of memorization to one of understanding. Although most first year high school chemistry textbooks include at least some introduction to the periodic table, the amount of general information that must be included often precludes any detailed discussion of the chemistry of any given element. Many books have tried to fill this void by including a vignette of sorts that highlights different elements in each chapter. Although students may or may not read these, they did not seem like enough to give our students a workable, lifelong understanding of the organization and the chemical properties of the chemical elements that they would be encountering throughout their lifetimes.

With that goal in mind, about 25 years ago MRF initiated “The Element of the Month” as an extra credit opportunity for students. In brief, students were to prepare a poster each month describing the properties, chemistry and uses of that month’s elements. (You will find the rubric used for the poster below.) Considering that the school year is approximately ten months, we broke the elements chosen to be highlighted into one from each of eight main groups, one transition metal and one “student choice” element in June. This worked well, as the posters were then hung on the classroom walls for everyone to see. For several years we even sent the best posters to the middle school each month. The problem, of course, was that too few students bothered to do the extra credit posters, and although others may have fleetingly read the posters on the wall, not enough students were getting the exposure to the elements that we were looking for.

At about the time we were coming to this realization, one of us (SWW) began volunteering at the high school, performing some end-of-the-year demonstrations on reaction rates for the students. The enthusiastic student and teacher response soon led to the expansion of that initial day of demonstrations to a monthly “Element of the Month” demonstration series that not only supported our long-standing extra credit opportunity for students, but also allowed all students to experience the chemistry of some of the more common elements on a much more personal level. Student participation in the extra credit opportunity soon increased substantially, as did the amount of effort that they put into their posters. Over the first few years, we refined the selection of the elements to be included to support new demonstration ideas, and eventually settled upon the following elements to be presented: sodium, oxygen, nitrogen, sulfur, iodine, copper, chlorine, phosphorus, and iron. We continued this series in its present form for fifteen years and the overall success of this initiative has been longstanding and enthusiastic.

Figure 2: Samples of sodium, nitrogen, oxygen, sulfur, iodine, copper, chlorine, phosphorus and iron.

For each element, its occurrence in nature, uses, physical properties, and chemical properties are highlighted. The occurrence in nature is discussed first. This is done to reinforce the concept that the elements are not artificial creations but in fact are the very substances of which our planet and universe are made. The students are asked where the element is to be found in nature, and this is an opportunity for some interactive discussion. For some elements, a sample of the ore or ores in which that month’s element commonly occurs are distributed to the class to view, packaged in clear plastic jars.1 Larger samples are preferable since they are more visible and give the students a sense of the density of the element. For example, a good sized chunk of either of the common ores of iron, hematite or magnetite, is noticeably heavy.2 Another point of discussion is whether the element is found uncombined in nature (O, N, S, rarely Cu or Fe), or only in the form of its compounds (Na, I, Cl, P). This is an opportunity to emphasize the reactivity of the element under ambient environmental conditions, and to discuss how the element may be isolated in its pure state. When possible, a sample of the actual element is displayed (see figure 2). Next, items of common everyday use that incorporate that element are displayed and briefly discussed. For example, for copper there are displayed a jar of pennies,3 a scrap of copper pipe and a couple of fittings, some electrical wire, a scrap of flashing, a piece of copper cookware, a brass doorknob, a scrap of pressure treated wood, and a jar of Bordeaux garden fungicide mixture (figure 3). Altogether, this part of the Element of the Month typically requires ten to fifteen minutes and is very interactive. Questions are posed to the students and answers are offered only after some input from the students.

Figure 3: Common items made of copper or containing copper compounds

A discussion of the physical and chemical properties of the element follows next, and becomes the point of departure for a series of classroom demonstrations that illustrate some of the chemistry of that element. This part of the program occupies the remainder of the class period and is also highly interactive with the students being engaged in discussion. What do they expect to see? What do they actually see? How may that be explained? These discussions are not only informative but also serve to heighten the anticipation of the next demonstration.

One point that we find ourselves repeatedly coming back to is the question of "How do we know that a chemical reaction has occurred?” We stress to the students that there are at least five macroscopic, observable signs of a chemical reaction (see figure 4).

Figure 4: Observable signs of a chemical reaction

We keep these written on poster hung in the classroom and refer to these “Five Signs” repeatedly throughout the year.

Articles for each Element of the Month (as listed below) will be published separately throughout International Year of the Periodic Table (2019).

  • Oxygen - O (To be published March 2019)
  • Nitrogen - N (To be published April 2019)
  • Sulfur - S (To be published May 2019)
  • Iodine - I (To be published August 2019)
  • Copper - Cu (To be published September 2019)
  • Chlorine - Cl (To be published October 2019)
  • Phosphorus - P (To be published November 2019)
  • Iron - Fe (To be published December 2019)

- Rubric for Poster Assignment

References and Notes

1. These samples were about 100 to 250 g in size and purchased from a scientific supply house.

2. Tom Kuntzleman's ChemEd X blog post, , includes a video related to these ores. (accessed 2/12/19)

3. Tom Kuntzleman's ChemEd X blog post, , includes a related video. Experiments with copper pennies start at around 4:10. (accessed 2/12/19)

Safety: 

Element of the Month - Sodium

$
0
0
Element of the Month - Sodium preview image

"In honor of the International Year of the Periodic Table this series of articles details the Element of the Month project developed by Stephen W. Wright (SWW), Associate Research Fellow at Pfizer Inc., and Marsha R. Folger (MRF), chemistry teacher (now retired) at Lyme – Old Lyme High School in Connecticut. Read for an overview of the project and links to the other articles in the series." - Editor

We start the Element of the Month program at the start of the school year in September with a discussion of sodium. Sodium is a special case of the Element of the Month program for two reasons. First, the students have not had an opportunity to engage in the Element of the Month program yet or to prepare a poster. The sodium discussion and demonstrations are used as a vehicle to introduce the program to the students. Second, the sodium demonstrations are usually conducted as a follow up to a “first day of school” chemical magic1 show designed to stimulate curiosity and interest. The sodium program is necessarily brief but must be interesting so that it does not appear dull when compared to the chemical magic that was just presented. Typically this is presented to the students not on the first day of school but it is done within the first two weeks.

Occurrence in Nature

Students will usually immediately respond that sodium is found in salt and seawater. We note that sodium is never found uncombined in nature and we will show why in a few minutes. Students are likely to be unaware that most sodium is to be found in a variety of minerals such as granitic rocks, which contain sodium along with other elements including potassium, aluminum, silicon, and oxygen. It is the weathering of these minerals that releases sodium ions that eventually travel to and accumulate in the sea.

Figure 1: Sample of products containing sodium - baking soda and table salt

Uses

Many sodium compounds are valuable industrial commodities, such as sodium hydroxide, sodium carbonate, and sodium bicarbonate. Sodium hydroxide is used in the manufacture of soaps and paper. Sodium carbonate is extensively used in the manufacture of glass and detergents. Many students will offer that sodium chloride is used as a seasoning and also to control ice on roadways. Items that may be displayed include a container of lye (sodium hydroxide), a box of washing soda (sodium carbonate), a box of baking soda (sodium bicarbonate), and a bag of rock salt (unrefined sodium chloride) (see figure 1).

Figure 2: Sample of sodium metal stored in mineral oil

Physical Properties

Sodium is an exceptionally soft metal. Students will likely have no experience with a metal that is so soft. We show the class that pellets of sodium are flattened by a gentle blow from a hammer and may be cut with a knife. To do so, we use one small pellet of sodium. First, we wipe off the protective oil with a dry paper towel or tissue (see figure 2). The sodium pellet is tapped with a hammer and then cut with a butter knife to emphasize how soft it is. While we do not show that sodium is conductive, we note that being a metal, it conducts electricity.

Chemical Properties

These experiments must necessarily be conducted on a small scale and video projection will be very helpful at making a small demonstration look bigger. We show the class that the sodium reacts with oxygen in the air to tarnish (oxidize) at once. A freshly cut surface is bright and shiny for only a few seconds. We note that the sodium in the stock bottle is stored under oil (figure 2). Why is that the case?

Video 1: Sodium metal reacts with water

Next we show that sodium metal reacts with water (video 1). We add one of the pieces cut previously to a glass crystallizing dish or petri dish containing water. While the reaction is occurring, we ask the class to not only watch but to listen to the reaction. We note that the reaction product is basic and add a few drops of phenolphthalein solution to the dish. Usually the students are eager that we repeat the demonstration using the other half of the sodium pellet.

Video 2:The reaction of sodium with chlorine

We could not show the reaction between solid sodium and chlorine gas in the lab safely, but video of the reaction is readily available (video 2) and can be shown to students. Students are generally interested to discuss and compare the properties of these reactants that produce something they ingest daily. 

Video 3: Sodium salt has a characteristic yellow flame color

Lastly, we note that a laboratory test for sodium is its characteristic yellow flame color and demonstrate the flame test (video 3). For those with gas stoves at home, it is sodium that is responsible for those flashes of yellow flame while cooking.

References and Notes

1. Chemical magic is stage magic that uses chemical reactions to produce a desired theatrical effect and entertain an audience. One of the most accomplished performers was Dr. Hubert N. Alyea of Princeton University and a former editor of the Journal of Chemical Education. See, for example: (a) Lippy, John D. Jr. Chemical Magic; A. L. Burt Co.: New York, 1930 (b) Ford, Leonard A. Chemical Magic, 2nd ed.; Dover: Mineola, NY, 1993 (c) Chen, Philip S. Entertaining and Educational Chemical Demonstrations; Chemical Elements Publishing Co.: Camarillo, CA, 1974. In this case, a series of chemical magic experiments are presented to the students to captivate their interest and to leave them questioning their assumptions about what they observed.

Collection: 

NGSSify Alka-Seltzer Rockets

$
0
0
text reads Glow and Grow w/ film canister and alkaline-seltzer

One of my students favorite inquiry labs to begin the kinetics unit is to create alka-seltzer rockets using old film canisters. Students are given a film canister, a quantity of alka seltzer of their own choosing and any materials available in the room to investigate factors that affect the rate of reaction.

Students generally choose to change the surface area of the tablet, the amount of water in the canister, the temperature of the water, other liquids besides water changes the time for the top of the canister to pop off. Some students measure how high the film canister top reaches.

For this activity students were given no procedure just a guiding question: “How does your factor affect the rate of reaction?” Students then had to create a one sentence claim, provide evidence and support it with reasoning. Students were given 80 minutes to determine what they wanted to test, do the experiment and get their CER boards ready for review. This was done with a mixed class of general and special education tenth grade students.

As opposed to a regular argumentation session, we had a glow and grow session, where students had to provide positive and negative feedback for each board. This can be done by having students walk around as groups and put a specific color post-it (usually green) for a way the group can grow, and different color post-it (typically yellow) for features of the board which were particularly well done by the group.

Below are some of the boards that were presented and their accompanying comments:

Glow and Grow Whiteboard #1

Student Glow Comments

  • Multiple trials completed
  • Easy to read
  • Clear

Student Grow Comments

  • Column unit (seconds) should be listed at the top of the data table instead of each box.
  • The reasoning is not specific to this reaction. This reasoning could apply to many reactions, be more specific information should be provided for the reaction you observed.
  • Justification of the procedure was not provided.


Glow and Grow Whiteboard #2

Student Glow Comments

  •  Multiple trials provided
  •  Nice use of colors to  differentiate warm and cool
  • Average of data obtained
  • Nice explanations in terms of the reaction

Student Grow Comments

  • Write seconds as (s) at the top of the data table instead of in each box.
  • Data table was slightly confusing to read.


Glow and Grow Whiteboard #3

Student Glow Comments

  • Nice use of colors
  • Nice explanation in terms of reaction
  • Good justification of how procedure was appropriate to test surface area 

Student Grow Comments

  • One trial is not sufficient to make any conclusion
  • Average data obtained was not calculated


Glow and Grow Whiteboard #4

Student Glow Comments

  • Nice explanation in terms of the reaction
  • Good justification of how procedure was appropriate to test surface area
  • Sufficient data collection

Student Grow Comments

  • Average of data obtained was not calculated
  • Tie reasoning together better than listing separate ideas
Safety: 

How I Fell in Love with PES

$
0
0
PES figure

When the topic of Photoelectron Spectroscopy (PES) was added to the AP Chemistry curriculum during the 2013 redesign, I was apprehensive.

I did not study PES in college so it was out of my comfort zone. I have spent the last few years gathering resources to help me teach PES. This year I stumbled on a new way to teach PES and I fell in love! I want to share this simple method so that other teachers might fall in love with PES - or at least tolerate it more!

In previous years, my students utilized the Arizona State PES flash simulation1 and Thomas D Silak’s Excel spreadsheet2 to compare PES graphs, two at a time, to find patterns. This year I only had access to Chromebooks. These Chromebooks could not access the website or the Excel spreadsheet. Frustrated with the lack of compatibility, I decided to be old-fashioned and print out the PES graphs from Silak’s Excel spreadsheet* for students. As a teacher that loves using technology to teach, printing the graphs felt wrong. But this old-school change - printing the PES graphs on paper - turned out to be a game changer in my teaching of the topic.

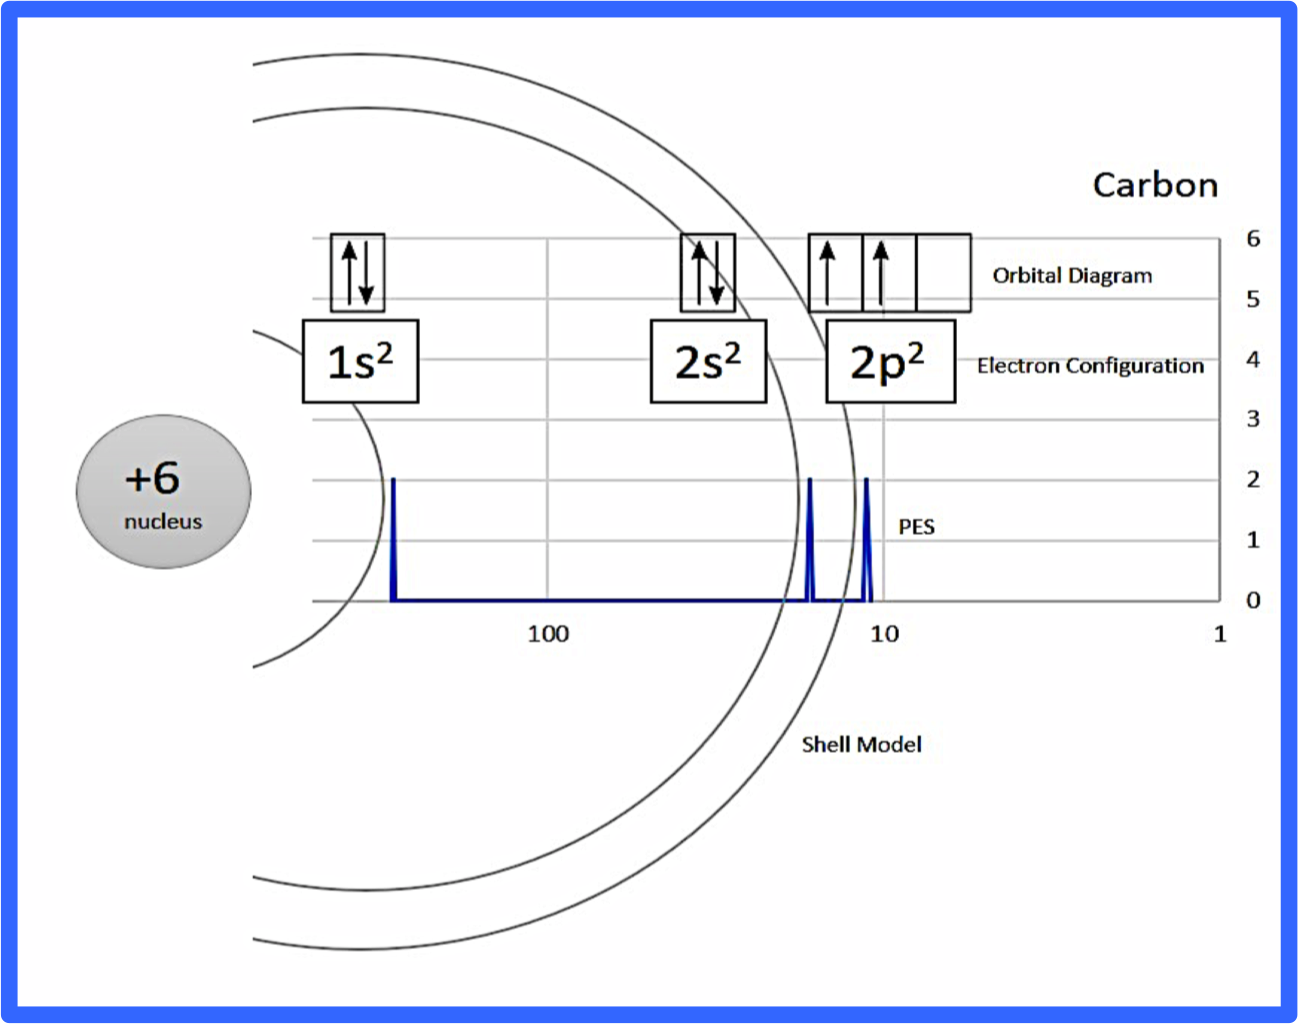
Figure 1: Example annotation for CARBON (you can find a PDF in Supporting Information)

After discussing the basics of PES with my students, I handed them paper copies of the PES graphs for the first 20 elements (see Supporting Information). I had students cut out and annotate the PES graph peaks with electron configurations, orbital diagrams, and shells (see figure 1 for an example). I picked these three methods of representation to model the atom because I wanted students to have enough information to make claims about why the PES peaks shift right, left, or increase in size.

Figure 2: PES graphs in order by atomic number

First, I had students line up the graphs by atomic number (see figure 2). I asked, “What do you notice about the peaks from one element to another?” As I hoped, they noticed that the peaks sometimes got taller and that the subshell peaks (ie. 1s) shifted to the left from one element to another. I asked them, “Why?” I instructed them to discuss with their table partners and use their annotations to help develop evidence and reasoning to back up their claims. I was tickled pink when they reported back to the class. Without my help, they were able to link the height of the PES peak with the number of electrons in the subshell using the electron configurations and y-axis. They were also able to attribute the shifting of the peaks left to the increasing nuclear charge using the shell model. One student also mentioned that there is a smaller gap between the 2s and 2p compared to the 1s and 2s. This was not a question that I expected, but it led to a great discussion about how the model of the atom has been refined from energy levels (ie. 1, 2, 3, etc.) to subshells (ie. 1s, 2s, 2p, etc.). This question also opened the door to explaining why the 2p valence electrons are removed before the 2s or 1s electrons when the atoms become ions.

Figure 3: PES graphs as periodic table

Next I had students arrange their PES graphs like the periodic table(see figure 3). I told students to look at the 2p peak for NITROGEN and OXYGEN and the 3p peak for PHOSPHORUS and OXYGEN. I asked them, “What do you notice?” Students noticed that the 2p peak in OXYGEN and the 3p peak in SULFUR was shifted right. Similar to before, students consulted with their table partners and backed up their claim using evidence and reasoning from their annotated graphs. This proved to be more difficult for students. They quickly noticed that the orbital diagram in both OXYGEN and SULFUR had one set of electrons paired, but didn’t know how to use that to explain why the trend occurred. With another guiding question, “What happens when two electrons get really close together?”, a few students were able to share with the class that when electrons are close together, they repel. These electron-electron repulsions cause the 2p and 3p electrons to be more easily removed than expected, resulting in a lower energy peak or a peak that is shifted to the right.

Finally, I handed them a PES graph of Scandium (a transition metal with a 3d electron). I told them to annotate the graph with its electron configuration. While most blindly completed the task, a few caught that the 4s and 3d peaks were reversed. Using a document camera, I showed the class the two different PES graph answers groups came up with (4s23d1 vs. 3d14s2). I had students discuss the two different answers and use the PES graph data to prove which answer was correct. The class used the height of the peaks to decide that 3d14s2 was correct. I asked them to use their PES graph to justify the electron configuration for the Sc2+ ion. Students were quick to pick up on how the 4s electrons would be removed before the 3d due to lower binding energy.

I followed the activity up with a formative assessment to check for understanding. The questions were modeled after the released questions 3a and 7a as well as a few secure multiple-choice questions from 2018 and 2017. My students scored better than previous classes on comparable PES formative assessments. I was so impressed with the results that I am thinking of using PES in my Honors Chemistry class to help with their understanding of periodic trends and ionization energy. I am hopeful that these PES graphs might provide a clearer picture of periodic trends for my younger students.

You might be thinking - how does analyzing the PES graphs on paper make it better? I took some time to reflect on why this year’s PES lesson produced better formative assessment results compared to previous years. My questioning strategies were similar between years so the big difference was using paper PES graphs instead of viewing them on the computer. After reflecting, I believe it was the ability to annotate and see three or more PES graphs at once that gave the paper version the edge. The annotations really helped my students understand the “why” behind the trends. It was very visual. Since all the graphs were available at one time on separate pieces of paper, students could see more graphs at once and could organize them in different ways (in a line by atomic number, or by periodic table arrangement). Students were more confident in finding patterns when they saw it over three or more graphs. I also found that the cooperative group discussions were richer when students viewed graphs on paper compared to computer screens. This could be because students were standing to see the paper graphs and they all helped rearrange the graphs while discussing. When using computers, most students had their eyes glued to the computer screen while talking with others. Since teaching the PES lesson this year, I discovered that Michael Bolt converted the PES Excel file into a Google sheet and graciously shared to the .3 Next year, I will have my students use his PES Google sheet on Chromebooks for part of the activity, but I will still print out and have students annotate PES graphs like we did this year.

My newfound love affair with PES is the result of many little things teachers have taken the time to share publicly. I feel very fortunate that we have such a welcoming and supportive chemistry teacher community! I hope that you can take something from my PES lesson, tweak it, and share it out again! Thank you to all the wonderful chemistry teachers that are so willing to share their ideas on ChemEd X, social media, and discussion boards. #sharingiscaring #bettertogether

*Special THANKS to Thomas Silak for allowing me to share images of the PES graphs from his document.2 ChemEd X readers can find them in the Supporting Information.

CITATIONS/ACKNOWLEDGEMENTS:

1 (accessed 2/25/19)

2 Thomas D Silak’s Excel PES spreadsheet -  (accessed 2/25/19)

3 Michael Bolt’s Google sheet PES Spreadsheet -   (accessed 2/25/19)


A Strategy to Build Relevance and Make Connections

$
0
0
lightbulb w/ text "Aha!"

I want to share a strategy that I have implemented in my classes this year and has been very helpful in establishing relevance to topics taught and in making connections between topics taught within a unit. This strategy also provides a way for students to ask questions and make written explanations of phenomena, which are “Science and Engineering Practices” of NGSS.

I first learned about the strategy from a fellow science teacher in my department, who loaned me a copy of the book, , by Kellie Marcarelli. I don’t use interactive notebooks in my classes the way they are described in the book, but I do think The Aha! Connections and Aha! Thesis strategy described in this book is gold.1 I have implemented my own version of this strategy in my classes for about 6 months now and it has gone really well so I want to share how I’ve used it in my classes.

Step 1: I break each unit down into 3-6 learning targets. Before beginning a unit, I choose a phenomenon that touches on as many aspects of the learning targets that make up the unit as possible. It will be challenging to find phenomena that apply directly to every learning target of every unit and it is okay if a phenomenon doesn’t hit all learning targets of a unit. The trick is to pick a phenomenon that touches on as many of the unit’s learning targets as possible.

Step 2: Students observe the phenomenon at the very beginning of the unit prior to any instruction. I ask them to write down as many observations as they can about it and to also to write down at least 2 questions they have about what they see.

Figure 1: Example of student "Big Question - Connections Page"

Step 3: After students have a moment to write down observations and questions, I ask them to share the questions they wrote. As they share their questions, I type them in to a Google Doc on the projector for all to see. Together we then select the question or questions we think are best to serve as our “Big Question” for the unit. I attempt to guide this selection process toward a question that most fully captures the core ideas for the unit and one that I think will lead to the best "Aha! Thesis" at the end of the unit. At the same time, I try to modify the student questions as little as possible. Students write the “Big Question” inside the light bulb on their “Aha! Connections Page" (see Figure 1).

Step 4: (Ongoing throughout the unit) After we have covered each learning target, I instruct students to go back to their  "Aha! Connections" page and write a short summary about how information learned in the learning target helps explain the phenomenon. They are essentially building the explanation to the phenomenon one piece at a time. By the end of the unit, students should have an outline for their "Aha! Thesis" if they completed the light bulb page throughout the unit.

Figure 2: Thesis Statement Guidelines

Step 5: At the end of the unit, students write their "Aha! Thesis". The "Aha! Thesis" is a argumentative writing piece providing an explanation of the phenomenon and an answer to the “Big Question” we decided on at the beginning of the unit. The "Aha! Thesis" must be supported by information the student learned throughout the unit. It could be supported by core ideas, lab results, or other observations. See Figure 2 for the "Aha! Thesis Guidelines" I give my students. Given that the "Aha! Thesis" is an argumentative writing assignment, it is graded according my  I shared in a previous post.

The "Aha! Thesis" is due the day of the final assessment for the unit. I find that this provides a good way to help students study for the assessment, synthesize many of the important ideas of the unit, and to make connections between learning targets.

Figure 3: Sample of Student Thesis (download the whole document below)

I want to give an example of this strategy. The following is a brief outline of the learning targets in one of my units, the "Aha! Phenomenon" I used, and connections I hoped students would make to the "Aha! Phenomenon" after we completed each learning target. See Figures 1 and 3 for a student sample of a "Aha! Connections" page and a "Aha! Thesis". (You can find the complete documents from Figure 1 - 3 at the conclusion of this post.)

Unit 1: Describing Matter

  • Learning Target 1-1: I can use particle diagrams as a way to model the structure of matter.
  • Learning Target 1-2: I can apply the Law of Conservation of Mass to explain situations involving chemical and physical change.
  • Learning Target 1-3: I can define mass, volume, and density in terms of a substance’s particles.
  • Learning Target 1-4: I can convert one unit of measure into an equal quantity of another unit.


The Aha! Phenomenon

  • A burning candle placed on a balance.
    • Students observed the mass of the candle appeared to decrease as the candle burned.
    • Students observe that cobalt chloride paper turns from blue to pink, indicating the presence of water.
    • The “Big Question” we settled on in class was something like: Why did the candle lose mass as it burned and where did the lost mass go?
      • The “Big question” was a little different in each class since these are student-generated questions.

Connections I Hope Students Make to the "Aha! Phenomenon"

  • Learning Target 1-1: Students learn that compounds are made of two or more different types of atoms connected together and that they can be broken down into smaller pieces. Students observed smoke, have evidence that water is produced, and with prior knowledge some students may know that CO2is produced as things burn. Students hypothesize that perhaps the candle wax is a compound and it was broken down into smaller pieces as it burned.
  • Learning Target 1-2: At first glance, it appears the burning candle broke the Law of Conservation of Mass since the balance showed a decreasing mass as the candle burned. However, students learned that the burning candle was not in a closed container and mass wasn’t really lost, it just escaped into the surroundings and the surroundings gained a little mass in the process.
  • Learning Target 1-3: Students observed smoke rise up into the room from the candle. They realize that the “lost” mass of candle rose up into the room because the hot gases from the burning candle must have been less dense than the surrounding air. We cover buoyancy in my honors classes, so those students should be able to add that the hot gasses coming off the candle displaced an amount of air in the room that weighed more than hot gasses themselves, resulting in a buoyant force pushing the hot gas molecules coming from the candle up into the room.
  • Learning Target 1-4: No direct relationship to the "Aha! Phenomenon" and that’s okay.
    • Note: Later in the year after students learn about the mole concept, you may revisit this phenomenon and then use dimensional analysis convert from grams of candle wax gained by the surroundings to the number of wax molecule gained by the surroundings as the candle burned.

Other phenomena I have successfully used as the "Aha! Phenomenon" for other units are: , and demonstrating a water bottle labeled with the number of hydrogen and oxygen atoms inside. 

You might want to pick up your own copy of Kellie Marcarelli's book, Teaching Science with Interactive Notebooks. 


1 - Kellie Marcarelli, , Sage Publishing, 2010.

Solution to Chemical Mystery #14: Loves Me...Loves Me Not

$
0
0
color changing acid-base chemistry

In Chemical Mystery #14, neutralization reactions were used to cause some interesting color changes. See the two videos below:


In both experiments an indicator was used that contained a mixture of p-nitrophenol and phenolphthalein (Table 1). p-nitrophenol changes from colorless to yellow around pH = 6, while the phenolphthalein changes from colorless to pink around pH = 9. Mixing these two substances creates an indicator that changes from colorless to yellow at pH = 6, and then from yellow to red at pH = 9 (Table 1).

Table 1:Colors of indicators at various pH levels.

Indicator

Color at pH incidated

Below 6

6-9

Above 9

p-nitrophenol

Colorless

Yellow

Yellow

Phenolphthalein

Colorless

Colorless

Pink

(mixture of phenolphthalein and p-nitrophenol)

Colorless

Yellow

Red


The first experiment is easy to set up and carry out, while the second is a bit more complicated. Detailed instructions for setting up and carrying out each experiment are listed in the appendix to this blog post.

Explanation of the first experiment: In the first experiment, color changes from red to colorless and back to red were observed. To pull this off, cups were set up with varying amounts of acid, base and indicator formed from the mixture of p-nitrophenol and phenolphthalein (figure 1). If you look carefully, you will notice that cups with “lips” at the bottom were specifically chosen for this experiment. This was done to hide the fact that small amounts of liquid poured into the bottom of many of the cups. Thus, at the start of the experiment, it looked as if only the first cup (A) had any liquid in it. At the start of the experiment only cup B contained any indicator, but because the contents of cup B were acidic (pH = 2), the indicator appeared to be colorless.


Figure 1: Concentrations and amounts of acid, base, and indicator in the red-to-colorless experiment.


The simple explanation is that when cup A was poured in cup B, a solution with a pH > 9 resulted, causing the contents of the mixture to appear red. When the resulting contents of cup B were poured in cup C, an excess of acid resulted, changing the mixture colorless. Finally, when the resulting mixture in cup C was poured in cup D, an excess of base with pH > 9 was produced, changing the color back to red. A quantitative description of the reactions and pH values that result from each mixing experiment can be found in the appendix.

Explanation of the second experiment: In the second experiment, color changes from red to colorless to yellow to colorless and back to red were observed. Again, cups were prepared with varying amounts of acid and base (figure 2). To achieve the yellow color, sodium bicarbonate (a weak base) rather than sodium hydroxide (a strong base) was used. I’ll discuss what goes on in the first six cups in this experiment (A-F), and from this you should be able to figure out what happens with the last four cups (G-J).

Figure 2: Concentrations and amounts of acid, base, and indicator in the first six cups of the red-colorless-yellow-colorless-red experiment. Not shown: cup G (7.5 mmol H+), cup H (10 mmol NaHCO3), cup I (15 mmol H+), and cup J (30 mmol OH-).

The start of this experiment looked like the first experiment: when cup A was poured into cup B, a solution with a pH > 9 resulted, causing the contents of the mixture to appear red. Also, when the resulting contents of cup B were poured in cup C, an excess of acid resulted, changing the mixture colorless. However when cup C was poured into cup D, a yellow color resulted. This is because the weak base (bicarbonate) present in cup D only increased the pH of the resulting solution to 8.3: high enough to cause a color change to yellow, but not high enough to shift to red. Upon pouring the resulting contents of cup D were poured into cup E, the mixture was acidified, causing a shift back to colorless. Finally, pouring the resulting contents of cup E into cup F caused a shift back to high pH and a change to red color. Again, a quantitative description of the reactions and pH values that result from these mixing experiments can be found in the appendix.

It should be possible to create all sorts of color changing variations using different combinations of indicators, strong acids, strong bases, weak acids, and weak bases. I think it would be a great exercise to challenge students to come up with a particular color changing sequence. For example, is it possible to have colors alternate red-yellow-red-yellow-red without an intervening colorless step? Or, what is the largest number of cups you can get to alternate back and forth between color changes? Please do let me know if you and your students discover some interesting variations!

Appendix: Detailed instructions for setting up each experiment.

Preparation of the indicator mixture: Dissolve both 1.5 g of p-nitrophenol (pKa = 7.2) and 0.75 g phenolphthalein (pKa = 9.7) into 30 mL of 95% ethyl alcohol. Alternatively, the red indicator purchased as part of the can be used. It should be noted that I used the red indicator purchased as part of the kit in all experiments presented in the videos.

Experiment 1:red to colorless to red

Prepare four cups as follows:

Cup A: 100 mL of 0.01 M NaOH

Cup B: 10 mL of 0.01 M HCl + 5 drops of indicator mixture.

Cup C: 10 mL of 1 M HCl

Cup D: 10 mL of 3 M NaOH

When ready to present, pour the contents of cup A into cup B. Then pour the contents of cup B into cup C. Finally, pour the contents of cup C into cup D.

Experiment 2:red to colorless to yellow to colorless to red

Prepare 10 cups as follows:

Cup A: 100 mL of 0.005 M NaOH

Cup B: 10 mL of 0.01 M HCl + 5 drops of indicator mixture.

Cup C: 7.5 mL of 0.1 M HCl

Cup D: 10 mL of 0.1 M NaHCO3

Cup E: 5 mL of 0.5 M HCl

Cup F: 10 mL of 0.5 M NaOH

Cup G: 7.5 mL of 1 M HCl

Cup H: 10 mL of 1 M NaHCO3

Cup I: 5 mL of 3 M HCl

Cup J: 5 mL of 6 M NaOH

When ready to present, pour the contents of cup A into cup B. Then pour the contents of cup B into cup C, cup C into cup D, and so forth finishing with pouring the contents of cup I into cup J.

Quantitative description of the first experiment:

1. Cup A into cup B: First, cup A was poured into cup B, causing the following chemical reaction:

H+ + OH-à H2O           Equation 1

The 1 mmol of OH- in cup A completely neutralized the 0.1 mmol of H+ in cup B, leaving an excess of 0.9 mmol of OH- in 110 mL of solution. The pOH of the resulting mixture was equal to –log(0.0009/0.110) = 2.1, which corresponds to a pH = 11.9 – and the solution turned red!

2. Cup B into cup C: Now when the resulting contents of cup B were poured into cup C, the 10 mmol of H+ in cup C neutralized the remaining 0.9 mmol of OH- from cup B. This left an excess of 9.1 mmol of H+, and the solution turned colorless.

3. Cup C into cup D: Finally, when the resulting contents of cup C were poured into cup D, the 0.30 mmol of OH- present neutralized the remaining 9.1 moles of H+. I’ll leave it to the reader to show that the pH of the final solution was 13.2, which is why the solution turned red. Remember, there is a total volume of 130 mL in cup D after the mixing is over!


Quantitative description of the second experiment:

1. Cup A into cup B: Cup A was first poured into cup B, causing the following chemical reaction:

H+ + OH-à H2O           Equation 1

The 0.5 mmol of OH- in cup A completely neutralized the 0.1 mmol of H+ in cup B, leaving an excess of 0.4 mmoles of OH- in 110 mL of solution. The pOH of the resulting mixture was equal to –log(0.0004/0.110) = 2.1, corresponding to a pH = 11.6 and a resulting red solution.

2. Cup B into cup C: Now when the resulting contents of cup B were poured into cup C, the 0.75 mmol of H+ in cup C neutralized the remaining 0.4 mmol of OH- from cup B, leaving an excess of 0.35 mmol of H+ in a colorless solution.

3. Cup C into cup D: When the resulting contents of cup C were poured into cup D, the following reaction took place between the 0.35 mmol of H+ remaining in cup C and the 1 mmol of HCO3- present in cup D:

H+ + HCO3-à CO2 + H2O           Equation 2

At the conclusion of the reaction, 0.65 mmol of HCO3- remained in a total of 130 mL of solution, yielding a solution containing 0.005 M HCO3-. Using Kb = 2 x 10⁻⁸ for HCO3- (and assuming no CO2 formed remains dissolved in solution) it can be shown that the resulting solution has a pH = 9: right on the border of the color change from yellow to red. Experimentally however, this solution appeared yellow, very likely because CO2 remaining in solution lowered the pH below the critical value of pH = 9.

4. Cup D into cup E: When the resulting contents of cup D were poured into cup E, the remaining 0.65 mmol of HCO3- were completed neutralized by the 2.5 mmol of H+ in cup E via Equation 2. This left an excess of 1.85 mmol H+, resulting in a colorless solution.

5. Cup E into cup F: When the resulting contents of cup E were poured into cup F, the remaining 1.85 mmol of H+ were completed neutralized by the 5.0 mmol of OH- in cup F. This left an excess of 3.15 mmol OH- and a red solution.

The results of the remaining mixing events will be left for the interested reader to calculate.


Safety: 

Reflections of an AP Chemistry Exam Reader

$
0
0
Utah landscape with text "AP READING"

I was lucky enough to be selected to read the Advanced Placement Chemistry Exam in Salt Lake City, Utah this past June for the second time. Let me share some of the tips I learned.

Reading the Advanced Placement Chemistry Exam was an extremely valuable experience. Being exposed to how students around the nation answer these challenging chemistry questions was probably the best professional development I have ever received. Generally, chemistry readers are trained and assigned to one question of the seven free response questions asked on that year’s exam. Sometimes, readers will be moved and retrained on a different question later on in the week depending on how long the question takes to grade. By the end of the week all readers have seen thousands of responses to only 1-2 free response questions; from short, sweet and to the point logical answers to confusing, superfluous, and imaginative incorrect answers. After reading thousands of answers over the course of two AP Chemistry readings, I would like to share some pointers that AP Chemistry teachers should consider sharing with their students during the AP chemistry course in order to best prepare them to be successful on the exam.

First, familiarize your students with the format of the AP exam. Based on my experience, it is evident that many students go into the exam blind to what is going to be asked of them. It is important they understand the format of the exam to allow for proper expectations and to plan their time most effectively. I recently posted about the exam format, but here are a few pointers:

  • The AP Chemistry Exam Section I consists of 60 multiple choice questions in 90 minutes.
  • The questions are bound in a book with a reference table.
  • The AP Chemistry Exam Section II consists of three long questions, each requiring an average of 23 minutes and awarding the students up to ten points each, as well as four short questions requiring an average of nine minutes and awarding up to four points each.
  • Each free response question is written on one to two pages with no space for work. After the entire question, multiple pages of paper are provided in the bound book for the responses.

It is important for the students to see this formatting before the exam so they know how they want to organize their work. I recommend giving the students a practice exam so they have experience with this set up. You may choose to give an old exam; but be aware the students have access to the answers online. If you completed the AP audit, you have access to multiple practice exams. These practice exams are secure; meaning that they should not be posted on any websites or available for students at home. Therefore, it is important for AP chemistry teachers to be sure to keep the tests in class only so other teachers can use it as an authentic assessment.  My students took all of the practice exams at some point in the school year and when I asked what the most valuable tool was for reviewing, the majority of students mentioned these practice exams. The students were able to practice time management and actually see the format of the exam prior to exam day.

Students need to learn to organize their free-response answers properly. Readers must read all the pages of work surrounding and following the question they are grading. So if the student writes some answers next to the questions and others on the extra paper, we grade it all.  But there are some serious problems that can arise when students are unfamiliar with the exam format and what is expected of them.

As mentioned previously, the free response questions are written with very little room for students to work their answers out in the space provided below the question. The exam is not designed for students to complete their work on the exam booklet near the question (unless there is an answer box such as for Lewis diagrams). They are supposed to show their work and answers on the provided spaces after each question within the answer booklet. I understand that it can be difficult for students to continuously turn the pages back and forth in order to see the question and then write their answers. But it is definitely better than trying to write in the tiny spaces between questions. Too often students write too small and it is nearly impossible to read the response. The students who write that small in pencil also have the problem of writing too softly making the answers too light to read. If it is impossible to read, readers usually call upon their table leader to help them read the student’s response. However, if the answer is illegible it will not receive points. Rather than writing tiny, students should know to write their work and answers in the appropriate areas of the exam, after the question. For long written responses the amount of room between the sub-questions is entirely insufficient. And for long mathematical questions students trying to squeeze their work in to that small space will suffer lost points if the reader can’t find key numbers and logical work that is labeled and clear. If a student wants to ensure they will receive their maximum points they should write all the answers in one location, and only write their answers once! So many students wrote their correct answers next to the question and then realized they had extra paper and decided to transfer their work over. The problem is, a large fraction of those students transposed answers wrong or gave entirely new answers. So now many students have two sets of different answers. Generally speaking, the readers are told to take the second answer only. This year I have organized all my major assessments to look like the AP exam, this way my students are trained on the best way to organize their answers all year long.

All mathematical questions require work, even if the question doesn’t explicitly say so. Readers cannot award points for correct answers if there isn’t at least a set up given. This year I read question 1 of the 2018 exam including a two-point question requiring students to convert molarity and volume to mass. The students were awarded one point for finding moles and a second for finding the mass. The correct answer can be easily found all in their calculator but if the student only recorded 7.91g they received 0/2 points. They had to show work (0.10000L x 0.500M = .0500mol and 0.0500mol x 158.1g/mol = 7.91g  NOTE: significant figures were not graded on this question). Students received one point for the initial mole calculation and the second point for the mass calculation.

If there is a place for students to draw particle diagrams, Lewis structures, graphs, or any other drawing, and the student makes a mistake within that area they are more than welcome to cross it out and redraw it on the extra paper. Crossed out answers are never read.

Students may not understand the question prompts. It is important for students to know what key prompts mean such as the prompts outlined the table below. Many teachers may find teaching this prompt vocabulary is not within the scope of AP Chemistry; that the students should already know what these terms mean. But if you want your students to perform at their best ability, it is important to outline the expectations of each prompt so the students know exactly what to provide in their answer. The following chart has a small list of prompts that have been seen in the more recent exam questions. The “meaning” next to each prompt is how the prompt is explained in my classes.

Prompt

Meaning

Notes

Justify your answer

Show all math work and explain how one knows the answer is correct using new information not presented in the question.


State evidence

Use information from the question (data chart, graph, etc.) to prove a statement and provide reasoning including new connections not already made in the question

Notice that “state evidence” is different from “justify” in most cases because the question is specifically asking the students to refer to given information.

Calculate

Show all work with the appropriate equation used, significant figures, and units for the answer.


Explain

Make clear by describing in more detail with new relevant facts.


Represent

Draw or model the description provided.

A particle diagram and specific directions often accompany this on how to draw the particles as well as many particles to draw. Students must follow the rules to obtain credit.

Identify

Select the correct answer.

Generally speaking, a short answer will suffice. No justification needed.

Estimate

The value has a range of answers but must be with in an acceptable range and with proper significant figures.

If the glassware used reads to the hundredths place the estimate must have the hundredths place value.

In terms of

Use the following words in the explanation along with new relevant details that connect to the terms.

Have students underline the terms required and after answering the question, check to be sure they used the terms or a synonym to the term.

According to the graph

Find evidence in the graph that explains the phenomenon and explain your reasoning.


For example, I graded question 1(e)(ii) from the 2018 exam requiring students to convert a previous answer to kJ/molrxn and “include the appropriate algebraic sign with your answer.”An alarming number of students obtained the correct value but never provided the correct negative sign. And because the question required the algebraic sign, readers could not accept the term “released.” Therefore, any answer that did not also include the negative sign was not awarded full points. Additionally, in question 1d of the 2018 exam, students were asked “According to the graph, what is the temperature change of the reaction mixture?” Unfortunately, hundreds of students answered this question by stating, “the curve of the graph increases and then plateaus”, never providing a numerical answer.

The exam is not wrong. This is something some students battle with. Question 1(f) of the 2018 exam asked: “The magnitude of the enthalpy change calculated from the results of the second experiment is the same as the result calculated in part (e)(i). Explain this result.” Many students refuted this statement, saying the student must have done the second trial incorrectly, awarding the students no points. The students should have explained the comparison by mentioning that both the magnitude of heat increased and the amount of moles increased by the same factor and when divided to obtain kJ/mol the factors canceled.   However, if a different question asks students to “agree or disagree” with a statement, this is the time the statement could be incorrect. For example, the 2018 exam question 2(c) question asked, “The student hypothesizes that increasing the temperature will increase the amount of N2O3(g) in the equilibrium mixture. Indicate whether you agree or disagree with the hypothesis. Justify your answer.” I have heard from question 2 readers this year that many students answered the question vaguely and never actually wrote if they agreed or disagreed, thus earning no points. Make sure your students have practice with these types of questions.

I hope you found the reflection and pointers beneficial and you can incorporate some of the ideas. Personally, having read the exam two years in a row, I have walked away with so many new ideas and insights that I have tried to share. I recommend looking into becoming a reader (details on CollegeBoard.org)! Most teachers I have met at the reading say that reading the AP Chemistry Exam is the best professional development they have ever had. Additionally, fellow AP Chemistry readers and I will be holding a mock reading at the ChemEd Conference, this July. If you are interested in attending, follow the link for details.


High-Impact Strategies for Implementing Next Generation Science Standards

$
0
0
NGSS Science and Engineering Practices Groups

This year I have the opportunity to work with a new team of educators to teach and assess the Next Generation Science Standards (NGSS) in our high school’s general chemistry course. We are invested in engaging our students in Three-Dimensional Learning, which NGSS describes as follows:

This is what students’ experiences in classrooms implementing the NGSS should reflect: developing and using elements of the three dimensions, together, purposefully (i.e., to explain phenomena or design solutions to problems). Lessons and units aligned to the standards should be three-dimensional; that is, they should allow students to actively engage with the practices and apply the crosscutting concepts to deepen their understanding of core ideas across science disciplines.1

This first, in a series of articles, aims to introduce readers to four of the high-impact shifts in mindset and practices we believe are helping our students learn to be better scientists:

  1. Intentionally engage students in Science and Engineering Practices.

  2. Start with an anchoring phenomenon students want to understand.

  3. Create opportunities to assess students’ Science Practices.

  4. Use Crosscutting Concepts to connect learning across disciplines.


1.  Intentionally engage students in Science and Engineering Practices.

Perhaps the biggest difference in my practice this year compared to what I’ve done in past years is the emphasis we place on what NGSS identifies as “Science and Engineering Practices”. The National Research Council provides a rationale for explicitly teaching these practices:

Standards and performance expectations that are aligned to the framework must take into account that students cannot fully understand scientific and engineering ideas without engaging in the practices of inquiry and the discourses by which such ideas are developed and refined. At the same time, they cannot learn or show competence in practices except in the context of specific content.1

My colleagues and I develop our curricula around a belief that students who regularly engage in these Practices are better equipped to learn specialized disciplinary content with greater autonomy compared to students taught in a more traditional, content-centric model. For example, a student with well-developed NGSS Practices can develop targeted questions when presented with a phenomenon, plan and carry out investigations, analyze and interpret data to develop models, and construct explanations around that phenomenon, with little if any need for teacher-directed instruction.

Our goal is to intentionally build opportunities into our curriculum for students to engage in Science Practices around central phenomena chosen to evoke curiosity in and provide context for our learners. We find it helpful to think about the eight NGSS Practices as components of three overarching groups identified by Instructional Leadership for Science Practices: Investigating, Sense-Making, and Critiquing Practices, illustrated in figure 1 below.2

SEP Groupings

Figure 1: Three over-arching groups of science practices

Subsequent articles in this series will focus specifically on how we are teaching and assessing the NGSS Science and Engineering Practices, and how we develop units of study using the Practices around a central phenomenon.


2. Start with an anchoring phenomenon students want to understand.

Many science teachers choose to teach science because we love science. Learning and practicing science may not challenge us the way it does many of our students. The biases of our own understanding may cause us to assume our students see the same relevance and interconnections we now take for granted. This is why we center each unit of study around an anchoring phenomenon. On his website The Wonder of Science, NGSS educational consultant and YouTuber describes the role phenomena can play in a science classroom:

A phenomenon is simply an observable event. In the science classroom a carefully chosen phenomenon can drive student inquiry. Phenomena add relevance to the science classroom showing students science in their own world. A good phenomenon is observable, interesting, complex, and aligned to the appropriate standard.3

While a phenomenon may be complex in terms of the fundamental laws that explain it, the actual events we present our students are often quite simple. For example, we begin our investigations into matter properties and interactions with an evaporation “race”. Students design an experiment to test how quickly six different liquids evaporate from a lab bench (we use water, some alcohols, and hexane). Students are astonished at how rapidly the streak of hexane evaporates, while the water streak remains past the end of class (see figure 2). We seize a “Did you see that?!” moment and provide students structured time to wonder why it happened and to construct quick models that might explain what they observed.

Figure 2: Evaporation Race Streaks

When students realize their models are too limited to explain a phenomenon, we provide them time to ask questions, design investigations, analyze and interpret new evidence, refine their models, and construct new explanations surrounding the phenomenon. Students now use this seemingly simple phenomenon to help explain complex concepts including Coulombic interactions, differences in melting and boiling temperatures, bond characteristics, bond and molecular polarities, dissolving and dissociation, and why polar molecular and ionic substances are insoluble in nonpolar molecular substances.

Paul Andersen’s website is an excellent resource for all science teachers looking for age and content-appropriate phenomena. Subsequent articles in this series will elaborate on the phenomena we’re using in our general chemistry course and how we leverage them to scaffold complexity and help students connect with content.


3. Assess Disciplinary Core Ideas and Science and Engineering Practices.

Veteran science teachers are experienced designers of content-driven assessments, but we tend to have less experience assessing Science and Engineering Practices. Our challenge is to design assessments that require students to engage in those Practices to demonstrate how well they understand “Disciplinary Core Ideas”, which NGSS defines as, “The fundamental ideas that are necessary for understanding a given science discipline.”1

One way we do this in a traditional paper-and-pencil setting is to provide students opportunities to construct models, or to analyze and interpret provided data, and then to use those models and data to explain how they either support or refute a claim pertaining to the Core Idea. The following example provides students a graphical representation of data and prompts students to demonstrate their proficiency in four standards:

  • Properties and Interactions of Matter (Disciplinary Core Idea)

  • Analyzing and Interpreting Data (Sense-Making Practice)

  • Constructing and Using Models (Sense-Making Practice)

  • Constructing Explanations and Designing Solutions (Sense-Making Practice)

(Our assessments are scaffolded in complexity and this example represents an entry-level prompt).

Ionization Energy vs. Electron Removed Plot

  1. Compare the graphical data for the two elements listed above. List at least two similarities in patterns that you observe.

  2. Contrast the graphical data for the two elements listed above. List at least one difference in patterns that you observe.

  3. In the space provided, construct a model for the elements to help support the description of the differences and similarities you’ve identified above.

  4. Which element, A or B, has a higher 1st ionization energy? Justify your answer using scientific reasoning.

  5. On the graph, circle the electrons you believe are located in the lowest (“innermost”) energy level for each element. Justify the difference in ionization energies for these inner electrons for element A and B by using scientific reasoning.

In addition to adapting our paper-and-pencil assessments to reflect the Science and Engineering Practices, we’re experimenting with problem-based assessments that give students more ownership of how they’re assessed. Early in the year we implement a “” in which students choose a material they find interesting and investigate how the molecular structure of the substance produces the material’s unique bulk-scale properties.4 Through this loosely-guided process, students are provided the opportunity to demonstrate proficiency in:

  • Properties and Interactions of Matter (Disciplinary Core Idea)

  • Constructing and Using Models (Sense-Making Practice)

  • Constructing Explanations and Designing Solutions (Sense-Making Practice)

  • Obtaining, Evaluating, and Communicating Information (Critiquing Practice)

Later articles will delve deeper into our attempts to meet the challenges posed by assessing student understandings and proficiencies against NGSS Disciplinary Core Ideas and Science and Engineering Practices.


4.  Use Crosscutting Concepts to connect learning across disciplines.

Next Generation Science Standards identify a number of themes present in all science disciplines, which they call “Crosscutting Concepts”. The National Science Teacher Association describes these concepts:

Crosscutting concepts have application across all domains of science. As such, they are a way of linking the different domains of science. They include patterns; cause and effect; scale, proportion, and quantity; systems and system models; energy and matter; structure and function; and stability and change. The Framework emphasizes that these concepts need to be made explicit for students because they provide an organizational schema for interrelating knowledge from various science fields into a coherent and scientifically based view of the world.5

Our goal in chemistry is to consistently and explicitly draw our students’ attention to these Crosscutting Concepts as we are engaged in them. In the front of every science classroom, we have posters for each Concept and we try to consistently ask students to consider which are reflected in the current Disciplinary Core Idea we are uncovering (see figure 3). We may also ask students to consider previously-studied science disciplines and recall a Core Idea that connected to the same Crosscutting Concept. (We also do this for the Science and Engineering Practices).

Crosscutting Concepts Posters

Science and Engineering Practice Posters

Figure 3:Crosscutting Conceptsand Science and Engineering Practices Posters 

Another strategy we are employing more consistently is to use smaller versions of the same posters in posting our students’ learning outcomes for each lesson (figure 4).

Learning Outcome with NGSS Posters

Figure 4: Student Learning Outcomes 

These practices are intentional attempts to make explicit the Crosscutting Concepts thematically interwoven through all science disciplines, which “... provide students with connections and intellectual tools that are related across the differing areas of disciplinary content and can enrich their application of practices and their understanding of core ideas.”1

Readers can download free copies of these posters, along with a multitude of other useful resources we use for teaching NGSS, from Paul Andersen’s .3


What’s Next?

Crosscutting Concepts are one of the three dimensions, along with Science and Engineering Practices, and Disciplinary Core Ideas that comprise NGSS Three-Dimensional Learning. Our goal as science educators is to provide our students with a true three-dimensional experience in learning and practicing science. Future articles in this series will dive deeper into each of the four strategies we identify as highly-impactful in helping our students learn to be better scientists, as well as provide practical examples of how we’re implementing them. This is our attempt to share what we’re learning and to continue to build a community of practice among science educators striving to successfully implement Next Generation Science Standards for our students.

Special thanks to Lauren Bowers, Jeff Vogt, and Rigel Crockett for the foundational work implementing NGSS in the course I now teach; to Paul Andersen and Christopher Zieminski for their continuing consultation and support; and to our current chemistry team at American School of Dubai: Lauren Bowers, Zohra Backtash, and Vivian Huang.


References:

  1. National Research Council. 2012. A Framework for K-12 Science Education: Practices, Crosscutting Concepts, and Core Ideas. Washington, DC: The National Academies Press. .

  2. Science Practices Diagram. . (accessed Mar 3, 2019).

  3. Andersen, P., NGSS Phenomenon. . Also and  (accessed Mar 3, 2019).

  4. How it Looks in my Classroom: Obtaining, Evaluating, and Communicating Information in HS-PS 2-6, The Experimenting Teacher  (accessed Mar 3, 2019)

  5. NSTA. Crosscutting Concepts. . (accessed Mar 3, 2019).

SBG Hacks: Choose Your Own Adventure Quiz

$
0
0
student writing on paper

I was thinking about what I do as a chemistry teacher that is unique and other teachers might be interested in and it usually comes back to (SBG). I do a lot of presentations on SBG but I realized I have a lot of little hacks that I use to make SBG run smoothly that I do not have time to talk about during my presentations. My plan is for this to be a series of posts about things I do to make SBG run more smoothly in my classroom.

Hack #1: Choose Your Own Adventure Quizzes

The "Choose Your Own Adenture (CYOA)" quiz has been on my mind because it is the end of our grading quarter. I give my students a quiz every Friday, including the last Friday of the grading quarter. Usually by this time, this quiz is the third or maybe fourth time students have been assessed on these learning targets. The problem I ran into was students do not have the opportunity to reassess what is on the quiz they just took. To solve this problem, I took inspiration from the "Choose Your Own Adenture" books we probably all read when we were kids.


Image result for choose your own adventure


Figure 1: Image of many of the books belonging to the Choose Your Own Adventure series.1 

In reality, the CYOA quiz is not quite as exciting as choosing your ending in "House of Danger" but it is pretty close! 

Basically, I give students a full quiz over all the learning targets I would normally assess them on (again, this is the third or fourth time they have seen them) but I let students choose what questions they want to complete. Students take a few minutes to check their grades and jot down on a post-it which learning targets they need to work on. The quiz is basically a big reassessment that students did not have to sign up for in advance. 

I really only use this strategy at the end of the grading quarter but it works out well for all students. For the students who have borderline grades, it gives students an additional chance to show what they know. For the students who already have the grade they want, they can rest easy and I can be confident they have mastered the content because they have already assessed on it multiple times. 

Sometimes one learning target requires the answer from another (think percent yield). In that case, I will specify that those targets must both be completed, even if the student only needs to reassess one of them. You can see and download my stoichiometry unit CYOA quiz below if you are logged into your ChemEd X account.

This is how I will be ending the grading quarter next week! Next up in my SBG Hacks will be reassessments! 


  1. Originally published by Bantam House, the trademark  series has been relaunched by Chooseco LLC. (website accessed 3/6/19)
Supporting Information: 
Concepts: 
Viewing all 1106 articles
Browse latest View live